"The ocean carbon cycle change in the Arctic Ocean in response to warming, sea-ice melt and changes in pelagic ecosystems". The project is realized under the supervision of dr Nick Bates, the Associate Director of Research and Senior Scientist in BIOS. Within the project I was analyzing the seawater carbon chemistry data collected during three summer cruises in the Arctic (2009, 2010 and 2011) by Becky Garley, lab technician in BIOS. She provided me the DIC and TA data from those three years (2327 data points).
The next step was to arrange the data to a suitable data sheet/ spreadsheet and input it to the CO2calc software that computed the temperature, salinity, DIC and TA data into other carbon chemistry constituents such as pH, carbon dioxide partial pressure (pCO2), saturation state of calcite and aragonite (omega). After getting the output the results were arrange in new spreadsheet suitable for the Ocean Data View (ODV) which allows for the data visualization. At this point I was able to create maps showing the chemistry in the study area.


Ocean Data Management (5 - 16 Dec)

our teacher Murray
SAGA GIS


ODV (Ocean Data View)
Section plot showing the temperature along the chosen distance from the shore to outer Baltic Sea.


The time series of the salinity and temperature with depth in the chosen area of the Baltic Sea


Surface maps of the temperature of surface water in summer and winter in the Baltic Sea.

summer

winter
TS diagram for the selected area.
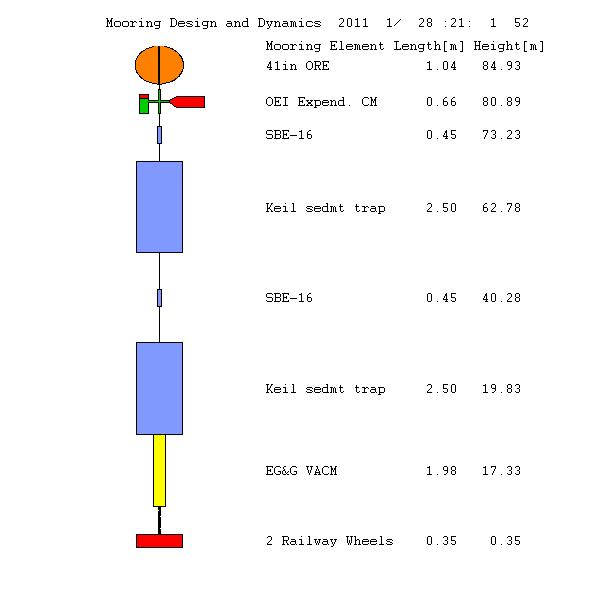
Moored Observatories (14 Nov - 2 Dec)
During this module we learned all about the mooring construction, properties and applications.
We made projects of the moorings that might be used in areas of our research back home. To do this we used MATLAB and Mooring Design and Dynamics.
We made projects of the moorings that might be used in areas of our research back home. To do this we used MATLAB and Mooring Design and Dynamics.


Satellites / Ocean Color (31 Oct - 11 Nov)
During this module we worked on individual projects using remote sensing data. The project has to consider problem alerted in our countries related to the sea/ocean. In my case it was summer bloom in the southern Baltic Sea.


Satellite detection of summer
cyanobacterial bloom in the Baltic Sea
Baltic Sea is a brackish
environment with low seawater exchange and high fresh water and river inflow.
This causes high concentration of nutrients and organic matter in the water
column which cause algal blooms. Blooms of nitrogen-fixing cyanobacteria occur
in late summer and because of their intensity, affect significantly the annual
carbon and nutrient cycles and increase the primary production. The cyanobacterial blooms in the open Baltic Sea are
usually dominated by Nodularia
spumigena, whereas other species might bloom in the coastal areas. Satellite detection of cyanobacteria is possible due
to their dense accumulations near the sea surface. The large agglomerates
at the surface are highly reflective at visible and near infrared wavelengths
due to the refractive index of the gas vesicles (Kahru, 1997). Cyanobacteria
form dense subsurface blooms and they can regulate their buoyancy. That is why
they are not uniformly distributed in the top layer of water in calm weather
conditions and cause underestimations in amount of phytoplankton in both in
situ and satellite methods measuring chlorophyll concentrations (Kutser, 2004).
In this project I would like to extract
information on cyanobacterial bloom occurrence between May and August 2010 and
the distribution of blooms in the Baltic Sea. At this point I expect to get
information about presence-absence of the bloom. In order to see cyanobacteria
accumulations, „bloom pixels” were extracted from „valid pixels” by changing
algorithm basing on the Kahru, 2007 studies.


Science Writing\ Core Skills (27 - 28 Oct)
During this course we were taught how to write different parts of scientific paper and other useful writings. During several assignments we had to provide: abstract, introduction, methods, grant proposal and CV.
Atlantic Explorer Cruise (24 - 25 Oct)/ part 1
Day 1
The cruise started really nice. The weather was good, sunny and warm. We departed from St.George to the south of Bermuda, BATS locations. On the way we deployed the mooring equipped with sediment trap It took us few hours because the mooring had to rich almost 4000m and stay there until April. Take this opportunity I set up a small experiment involving 11corals of two local species and one sea urchin, which we attached to the sediment trap and sent to 3200m. Corals and sea urchin were weighted and photographed. The aim of this experiment is to test if carbonate skeletons of corals will dissolve under different pH conditions. We will find it out on April.


Day 2
Second day of our cruise appeared to be not very lucky. The weather got bad and the ocean rough. But It was lucky for Maureen because during the night girls - Anya and Yuna - found, using the ADCP "the lost" mooring.


Chemical Oceanography (1 - 21 Oct)
Biological Oceanography (12 - 30 Sept)
So the third of our modules is biological oceanography. We started with microbiology in the the ocean, which can be translated as millions of cells of bacteria and viruses into 1 ml of water. That is scary! Now I never want to go swimming again ^^'
No! It's not gonna happen :)
Our assignment was to prepare slides with bacteria probes and measure them under the microscope by taking pictures and counting down the cells.
Before that there was a long way to go with preparation to DAPI and FISH analysis.


Physical Oceanography (22 Aug - 1 Sept)
Scientific Writing
During this course we practiced our writing skills by providing our ideas for titles, abstracts, introductions etc. on imposed subject.
General Oceanography (8 - 19 Aug)
Brief and nice module which concerned the general areas of oceanographic sciences from plate tectonics, ocean physics, chemistry and biology to ocean circulation and ocean-atmosphere relation.
During the lunch breaks...


Class...


